Photo by Genevieve Humphreys
Due to recent spikes in applications in the last few years, the Office of Admissions has implemented more ways of gathering information on prospective students. They are finishing up their third year of using the Environmental Context Dashboard (ECD).
The ECD collects data to attempt to quantify the adversity a prospective student might have faced in their educational and neighborhood environment. Trinity was one of the five schools who chose to pilot the ECD, which was created by the College Board. Other schools in the pilot program included Yale University and University of Texas at Austin.
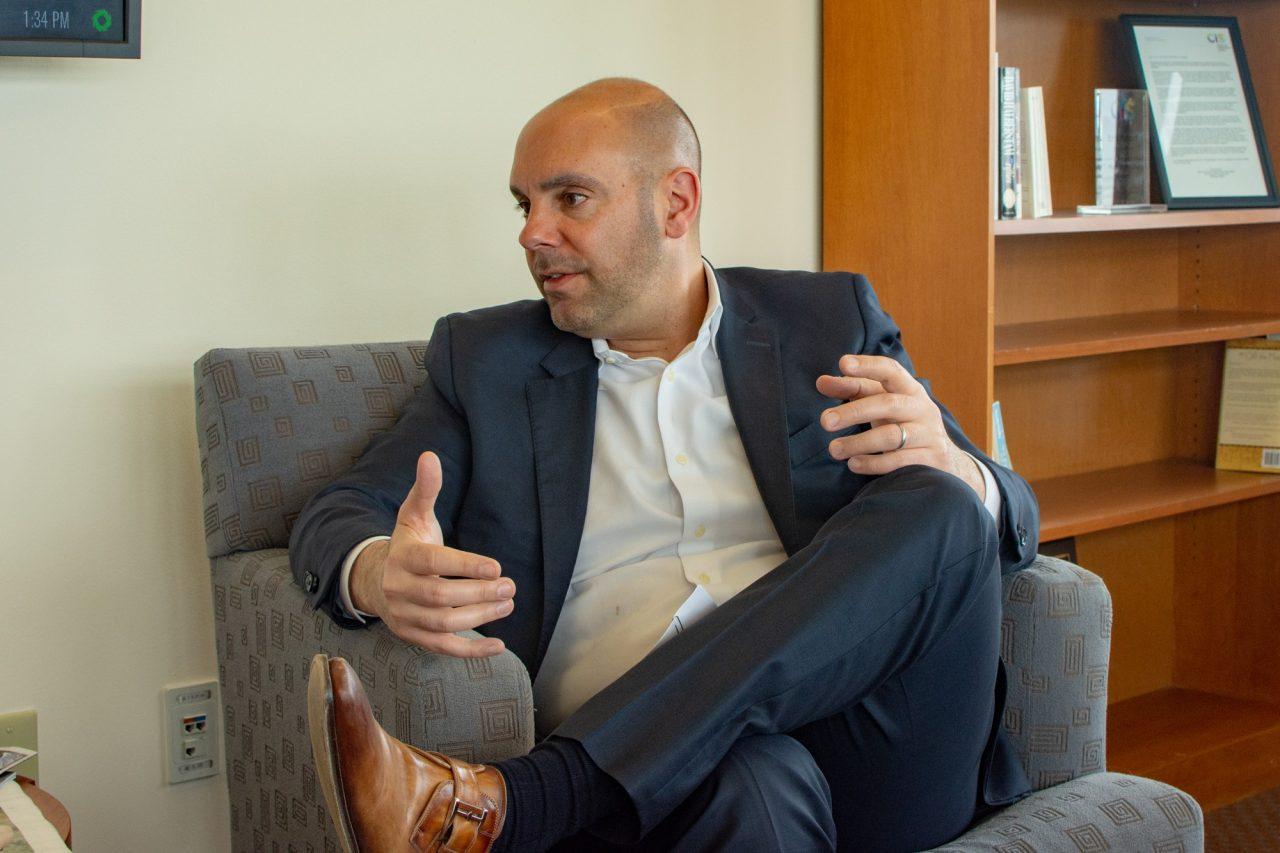
“We all piloted it for different reasons. [Trinity] piloted it because of our growing selectivity, and we felt like we needed more inputs for our staff,” said Eric Maloof, vice president for Enrollment Management. “My job as the vice president is to provide as many valuable inputs as possible for the admissions staff and our dean of Admissions to make educated decisions based on who they think is going to be most successful here at Trinity and craft a class that looks and behaves like the world our students are going out into after graduation. From my standpoint, the more inputs the better.”
To quantify adversity, the ECD collects data related to access to advanced coursework and socioeconomic diversity in a student’s high school as well as housing values, crime risk and other information relating to school or home.
“One topic that has emerged over the last few years that has been really important for our staff is the need for additional contextual information about students’ environments, particularly for those students who come from areas or attend high schools where the admissions office doesn’t have direct personal experience,” Maloof said. “This new environmental context dashboard offers objective, independent evidence to weigh alongside test scores, grades, co-curricular activities, their essay [and] letters of recommendation.”
Justin Doty, dean of Admissions, explains that students in more wealthy areas generally have greater access to educational resources like test prep and college counseling as well as the ability to take the SAT and ACT multiple times. Students in lower income areas might not have access to these.
“When it comes to college admissions, I feel like context is everything. When we know the playing field is not level for students across the country, this data provides us a better tool for analyzing applications,” Doty said. “If students are coming from affluent backgrounds or neighborhoods or high schools, they’re going to have typically more opportunity in terms of testing. As a result, you’re seeing typically higher test scores coming from those environments versus more disadvantaged backgrounds and neighborhoods.”
The dashboard is used most commonly when an application is sent to review within the admission committee.
“There’s clear admitted students on one end of the spectrum. There’s clear [inadmissible] students on the other end of the spectrum. And in the middle, that’s where we see a whole swath of students. That’s where we spend a lot of time in committee, where we do the full intensive review and looking at all aspects, and that’s where the dashboard has been helpful because we’ll see a significant amount of students with very similar testing, similar GPAs, and you’re trying to find ways of what distinguishes this applicant from these other 100,” Doty said.
Along with helping to distinguish prospective students from one another, Admissions hopes to use the dashboard as a tool for increasing diversity.
“Diversity means different things to different people. This is potentially providing opportunities and framing discussion so that we have an opportunity to attract and enroll students from low socioeconomic backgrounds,” Doty said. “Race and ethnicity certainly factors into it, but the other aspect has been rural students.”
Diana Young, assistant professor of business analytics and technology, agreed that the dashboard can potentially be used to increase diversity if used correctly.
“Anytime you’re using data analysis for an output, it can be used for good or for bad and applied correctly or incorrectly. In this case, I think that it has the ability to help level the playing fields for students by taking those qualitative factors to some degree into account,” Young said. “I think it has the potential to add new insights and allow us to see thing in different ways.”
Although the dashboard does provide multiple data points, any personal information provided by the student will supersede any information the dashboard has provided.
“It’s important to understand that the data in the dashboard, while systematically and constantly measured, does not necessarily represent the student’s personal experience, but rather suggests the environment to which they were likely exposed” Maloof said. “Consequently, it does not substitute for firsthand knowledge of the applicant or specific information that is conveyed by the applicant’s written narrative. It does, however, provide an additional lens to view the student’s application and might help us highlight or further explain the detail found in the application.”
Doty also emphasizes that students from low adversity levels will not be at a disadvantage in the admissions process just because they didn’t overcome adversity like other prospective students might have.
“We’re not counting anything against a student for not facing adversity like someone else did. It’s more about the students who have high adversity, framing that and giving more opportunities potentially for those students,” Doty said. “If we see low adversity we may note that, but it’s more about potentially helping to get a student in versus keeping a student out.”
According to Doty, the next step for the Office of Admissions is to start analyzing data on how well students who come from a range of adversity backgrounds are performing at Trinity.